Assembling an infrastructure for machine learning research
While working on machine learning research at the Astera Institute1, I led a team that assembled a system that enabled researchers to quickly and easily run experiments that used up to a full datacenter’s worth of GPUs. I intentionally wrote “assemble” rather than “build”, because the system mostly consists of off-the-shelf components. The challenge was in digging through the huge number of options for each possible piece of functionality, selecting appropriately, gluing things together into a working system, and designing an easy but powerful interface. I’m proud of how little code we wrote relative to how much functionality the system provides.
Let’s start with the core functionality that the system provided:
- Takes code from the user’s git branch.
- Runs the code on a cluster with a specifiable number of trials running in parallel, and with each trial using a specifiable number of GPUs.
- Executes a search using a specifiable search space and algorithm, or multiple trials with different random seeds to get a distribution of results for a fixed set of hyperparameters.
- Persists the results and makes them viewable in a web UI, or via CSV files.
Now let’s go into how this is all implemented!
The components
Hardware
We rented hardware from Voltage Park, who at the time only offered exactly one thing: bare-metal servers running Ubuntu with 8 Nvidia GPUs. Because of pre-existing contracts, we didn’t have any choice in hardware or cloud providers. This constrained the design space for some of the other parts of the system.
Kubernetes on Talos: Hardware abstraction and workload orchestration
Just as an operating system abstracts over CPUs and RAM on a computer and manages the life cycles of processes, Kubernetes abstracts over all the hardware in a cluster and manages the life cycles of containers.
We ended up using Talos, a Linux distribution that includes Kubernetes. Overall we were really happy with that choice. It’s well-designed, well-documented, and well-supported.
The journey
While there are alternatives, Kubernetes is by far the most popular system in this category and that brings with it a huge ecosystem of tools, services, patterns and documentation, so for me it was an easy choice.
The difficult thing was figuring out how to run it. Big cloud providers like Azure or CoreWeave provide a managed Kubernetes service. Because we were tied to Voltage Park, managed Kubernetes services weren’t an option. There are many ways to run Kubernetes on your own. I initially picked Kubespray because it was mentioned in the official Kubernetes documentation and it was built on Ansible, which we were already using. While I did successfully run a cluster using Kubespray, I was not satisfied:
- Creating or modifying a cluster is very slow. Like 30 minutes to apply a configuration change to a 6 node cluster.
- Doing normal things would often fail and leave the cluster in some unknown and probably invalid state that was very difficult to recover from. Because Kubespray makes changes to the underlying node OS, but it doesn’t take full responsibility for the OS the way Talos does, getting back into a good state would require reinstalling the OS and then re-running Kubespray, which would take over an hour.
- We had mysterious and hard to debug issues with the GPUs becoming inaccessible, which we worked around by rebooting the nodes.
- There is no paid support option and I couldn’t resolve the above issues using the free community-provided support (including the patchy documentation).
In contrast, Talos:
- Takes much less time to apply configuration (sorry I don’t remember the timing, but the fact that I don’t remember means it was not a big deal!).
- Installs the operating system in a pre-configured state such that it is ready to be part of the Kubernetes cluster, and the OS is immutable (read-only after installation), so it is much less likely to end up in weird states.
- Had no such flaky GPU issues.
- Has paid support options and excellent response times to community-reported bugs.
The main challenge we had with Talos is that our cloud provider did not give us a way to install a custom OS. After first trying to run it inside a VM inside the Ubuntu host, we ended up finding a way to overwrite Ubuntu with Talos from within Ubuntu! This meant we could run Talos on bare metal.
Distribution Registry: Container image hosting
Container images are the unit of distribution for code that runs on Kubernetes. A container registry is a service that stores and allows clients to upload and download container images. There are many options for cloud-hosted managed container registries, but we wanted our images to be stored on the same local network as our Kubernetes nodes in order to maximize bandwidth when downloading (AKA “pulling”) images. So we ran Distribution Registry inside our cluster.
The journey
The main difficulties with self-hosting the registry was in configuring network access. Our requirements:
- The registry is accesible via HTTPS to pods inside the cluster. This is needed because Katib (discussed below) fetches image metadata directly from the registry and there is no easy way to tell it to connect without HTTPS.
- Image pushes and pulls do not go through Tailscale, since that reduces bandwidth and our images are pretty large.
We ended up with the following solution:
- A Tailscale name is used for the registry. We configured Tailscale to automatically generate an SSL certificate so connections over HTTPS work.
- We configured our cluster’s DNS to forward requests for .ts.net domains to an in-cluster Tailscale DNS. So connections from inside a pod inside the cluster also go through Tailscale.
- We configured our containerd, which is responsible for pulling images when starting containers, to treat the registry’s Tailscale domain name as an alias of the registry’s in-cluster .svc.cluster.local name, thus bypassing Tailscale encryption and maintaining fast image pulls.
- We configured Kaniko (discussed below) to push to the registry through its .svc.cluster.local name, thus bypassing Tailscale ant maintaining fast image pushes.
Kaniko: In-cluster image building
Kaniko takes in a git repository URL and revision and a path to a Dockerfile within the repository, and it builds an image according to the Dockerfile and pushes it to our Distribution Registry. This is how a user’s code gets into a container image.
The journey
We started building images locally on the user’s computer and then pushing the image from there to the cluster. This worked, but due to some large dependencies (e.g. PyTorch alone is over 900 MB), any push of the image layer that contained the dependencies was very slow. Since the actual code being modified (i.e. the git repo) was much smaller, it made sense to upload only that from the user’s computer to the cluster, and then build the image in the cluster and then the push to the registry would happen over a fast local connection. This does require users to commit and push their code to git before starting an experiment, but that is a good practice anyways.
Katib: Multi-trial experiment orchestration
Katib is a system for running distributed hyperparameter search on Kubernetes. A “search” over different random seeds can be used as a way to get a distribution of results for a fixed set of hyperpartmeters. Katib is very flexible but that flexibility means it requires a lot of configuration for each experiment. We were able to simplify the user experience dramatically through a mix of automation and convention. The main things that Katib needs to know are:
- The search space. We require the user to write this in a YAML file.
- The metrics to optimize. We require the user to write this in the same YAML file.
- How to run an individual trial. E.g., container image to use, how many GPUs it needs. The Launch tool (described below) handles this automatically.
- How to pass in hyperparameter values for a trial. The Launch tool handles this automatically, by assuming the user’s code follows the convention of using Draccus (described below) or something compatible for command line parsing.
- How to extract metrics from a trial. The Launch tool handles this automatically, by assuming the user’s code follows the convention of using writing its metrics in Tensorboard format to the path specified in the --tensorboard_dir command line arg.
The journey
Before Katib, we tried Ray Tune. The things we liked less about Ray Tune than Katib:
- The APIs and documentation are a mess. In contrast, while Katib’s documentation is very incomplete, the repo contains lots of examples that are pretty instructive, and the APIs are much more intuitive.
- Ray Tune requires writing an imperative Python file using the aforementioned confusing APIs for every search. It’s much easier to check the validity of a static YAML file that configures Katib than to check for all the ways Python code might be wrong.
- Ray Tune seemed to require more restructuring of the researcher’s code.
- The only way to track progress is via terminal output (whereas Katib has a nice web UI), and even totally correct use of Ray Tune results in massive amounts of warnings and useless messages being printed.
Draccus: Training code configuration specification
Draccus is a simple Python library for defining and parsing configuration using dataclasses. The key thing that our system requires of the training code used for a trial is that a hyperparamter named “foo” is accepted and parsed via the command line flag --foo. This lets the Launch tool translate mechanically between the search space the user wrote in YAML and the command line for a trial.
The journey
The main alternative I considered was Hydra. Hydra seems to have a superset of the functionality in Draccus but the added complexity of all of the options didn’t seem worth the benefits. Due to the modular system design, it would be easy to switch later if the team decides Hydra is needed.
MLflow: Experiment metric tracking
While Katib tracks the metrics being optimized in a search, there are many other metrics that can be useful to analyze, and having a UI to visualize metrics throughout a trial and compare them across experiments is really useful. Storing artifacts like videos of an agent interacting with an RL environment is also key for understanding training progress. For this we used MLflow Tracking, a service to track metrics and store artifacts.
The journey
The main alternative I considered was Weights & Biases. While they have very similar sets of features, we ended up choosing MLflow because:
- It has documented HTTP APIs, meaning one can interact with it from any language. I didn’t want to be forced to use Python for all the tooling that might want to interact with our experiment metrics.
- It can be much cheaper. Databricks doesn’t make this clear, but if you provide your own storage (e.g. S3 bucket), they will host MLflow tracking for free. Or you can self-host for free.
Once we had settled on MLflow, the main challenge was finding and enforcing a convention on how to organize experiments and runs so people can find what they need. While I’m not confident this is the best solution, we ended up writing a small wrapper over the MLflow Python client that sets the experiment name and run name to match the Katib experiment and trial name. It gets this Katib metadata from environment variables set by the Launch tool. This at least makes it easy to go between the two systems.
Tailscale: Secure remote access
In order to create and monitor experiments, users need to have access to Katib and other services running in our cluster. We used Tailscale for this. It provides network encryption and DNS like a VPN but all the connections are peer-to-peer rather than forcing everything through a single VPN server. It works great and integrated seamlessly with our Google workspace accounts.
Launch: User CLI that glues it all together
The only part of this that we wrote ourselves is a tool called Launch. It is open source and written in Rust. Launch glues everything together. It takes in:
- A YAML file specifying the search space and to-be-optimized metrics.
- A --gpus flag, which specifies the number of GPUs per trial.
- A command to run for each trial.
And it:
- Triggers a build of a container image of the current git branch via Kaniko.
- Constructs a full Katib experiment spec. In addition to the info from the user’s YAML file, it tells Katib to pass hyperparameter values via command line args according to the conventions (described above in the Katib section), and it adds the --tensorboard_dir arg.
- Creates the Katib experiment.
- Prints URLs of Katib and MLflow UI pages for the experiment.
- Polls the cluster to check that the experiment starts and runs a trial succesfully.
The journey
The main question I struggled with was what language to use to implement the tool. Due to the available libraries for interacting with Kubernetes and Katib, Go was the obvious choice. The factors in favor of Rust were pre-existing expertise on the team and me thinking it would be more fun in Rust. The availability of libraries was almost decisive in Go’s favor until we discovered we could use the OpenAPI Generator to generate Rust client libraries for Kubernetes and Katib. Compared to Go, some of the nicest things about Rust are the power of the Serde library for deserializing configuration files and the error handling syntax (writing foo()? is so much nicer than if err := foo(); err != nil { return err } ).
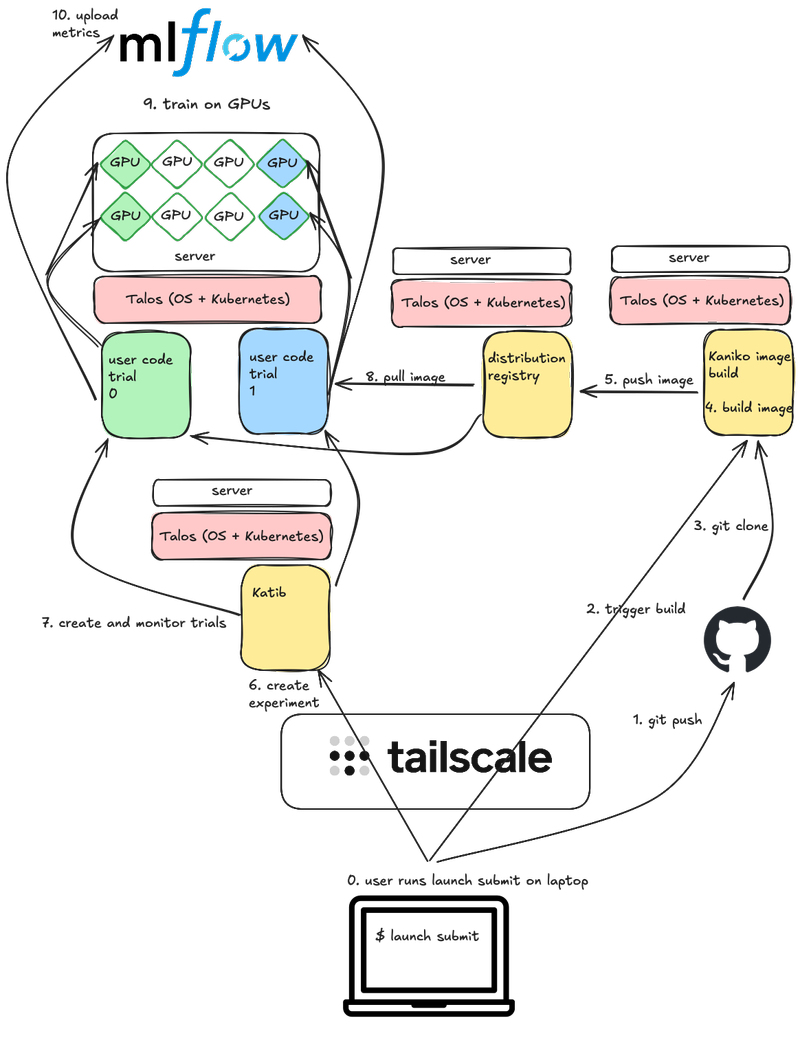
System diagram
Notes:
- In reality all of this could be running on a single server, or distributed as shown, or something in between. Kubernetes handles the scheduling dynamically.
- Not shown, but in addition to the depicted MLflow upload, user code also writes metrics to a local directory in Tensorboard format, which is what Katib monitors.
What could be improved
The biggest thing that I wish I could have improved before I left was the latency of building and pushing container images. While Kaniko is supposed to support caching, we weren’t able to get it working, so every time a user launches an experiment Kaniko would take a few minutes to rebuild the entire image (unless they didn’t change any code at all, in that case we would re-use a previously built image). The solution I wanted to try was to build and push the images using Bazel, which has many options for caching and would also allow us to have very fine-grained control over the image to optimize it for build speed. In particular, Bazel should make it possible to have one image layer per python package in our dependencies, so if a single dependency changes we wouldn’t need to rebuild and push a single huge layer that has all of our dependencies.
Another thing I wanted to do was to modify the Katib UI to allow adding a link from Katib to MLflow. This is hopefully a simple change.
Finally there are things which we didn’t implement only because we didn’t need them, but which I expected to need at some point. These include queuing experiment trials according to a priority (which I planned to implement via Kueue) and multi-machine trials (which I planned to implement via Kubeflow Training Operator).
Credits
Matthew Behrens and Mick van Gelderen helped a lot with many aspects. Among other things, Matt actually got Talos running, including figuring out how to install it from inside Ubuntu and finding versions of Talos and the Nvidia system extensions that worked with our hardware, and Mick implemented most of the Launch tool, discovered Kaniko and proved it could work.
-
This work was done in 2024. ↩